1990 Diesel Particulate Matter Concentrations Across the American Northeastern States
(By Census Tract)
(Click picture to view as PDF)
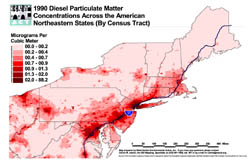
Short Description: 1990 Concentrations of modeled diesel particulate matter (PM) air toxics emissions from road sources for each US Census Tract in approximately 14 states in America's northeast corridor.
Data Details: The basemap polygons are 1990 US Census Tract boundaries. The state outlines are 1990 US Census State boundaries. The major interstate (I-95) was derived from the 1990 US Census Major Highways shapefiles. The 1990 air toxics emissions particulate matter (PM) dataset was obtained from the offices of the Northeast States for Coordinated Air Use Management (NESCAUM) as they obtained it from the Environmental Protection Agency's Cumulative Exposure Project (CEP). The data was originally modeled under the Assessment System for Population Exposure Nationwide (ASPEN) in order to predict US Census Tract level diesel PM concentrations as micrograms per cubic meter (µ/m3). Emissions data for 1990 was inputted to the ASPEN dispersion model by the Environmental Protection Agency (EPA), which subsequently produced the estimated concentrations. The legend is classified in quantiles. As a letter-sized landscape print out (see Map Maker's Notes below for details), the scale is approximately 100 miles to an inch. Magnetic north is up.
Credits: Map prepared by Carlos M. Jusino at West Harlem Environmental Action, Inc. (WE ACT) using ArcView® GIS v3.1 software from the Environmental Systems Research Institute, Inc. (ESRI).
Support: Funded in part by the former W. Alton Jones Foundation (now Blue Moon Fund) and by the National Institute of Environmental Health Sciences (NIEHS).
Map Maker’s Notes: This map was formatted for LARGE LEDGER paper. In its original state it is 11-inches wide by 17-inches tall. If you choose to print it, you may need to manually adjust the printer settings to shrink the map to Fit To Page (or a similar option to that extent) in order for it to be properly printed on standard letter-sized (8.5 x 11-inch) paper.
While a distinction exists between data for non-road sources such as airplanes, farm equipment, boats, construction equipment, etc, (vehicles that don't generally go on roads) and road sources such as cars, trucks, buses, etc., only the latter data (road sources) was used to generate this map.
Interstate 95 was added for effect since it is a major vehicle/truck/tractor trailer route for the transportation of goods.