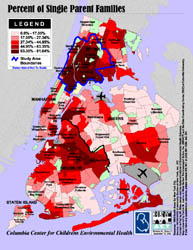
Percent of Single Parent Families

(Click to view as PDF)
Short Description: Percentage of single parent families living in New York City by Health Area.
Data Details: The basemap polygons are 1998 Health Area boundaries. The green spaces (parks, cemetaries, etc.) were derived from US Census landmark shapefiles. The dataset was obtained from INFOSHARE (Community Studies of New York, Inc., NY) and analyzed by the Data Management, Statistics and Community Modeling (DSM) Core at the Columbia Center for Children's Environmental Health (CCCEH). The legend is classified in quantiles. The study area outline and demarcation line between Brooklyn/Queens were generated by the WE ACT GIS Mapping Specialist. The neighborhood names were defined by the United Hospital Fund (UHF), and are considered to be UHF Neighborhoods. Magnetic north is up.
Credits: Map prepared by Carlos M. Jusino at West Harlem Environmental Action, Inc. (WE ACT) with assistance from the Columbia Center for Children's Environmental Health (CCCEH), using ArcView® GIS v3.1 software from the Environmental Systems Research Institute, Inc. (ESRI).
Support: Funded in part by the former W. Alton Jones Foundation (now Blue Moon Fund) and by the National Institute of Environmental Health Sciences (NIEHS).
Map Maker’s Notes: Staten Island is not to scale.
The blue solid outline representing the boundaries of the particular study area of the participants at the Children's Center was formed around Health Area boundaries.
The black solid line representing the demarcation line between the boroughs of Brooklyn and Queens is a virtual division marked by local city planning street designations.
The airplane over JFK airport faces northeast due to it being an international airport. The airplane over La Guardia airport faces west due to it being a domestic airport.